Pane types / chart
chart
Any single series over a window where the shape of the trend is the point — including non-financial metrics. Reach for price instead when it's a live quote and the current number matters more than the curve.
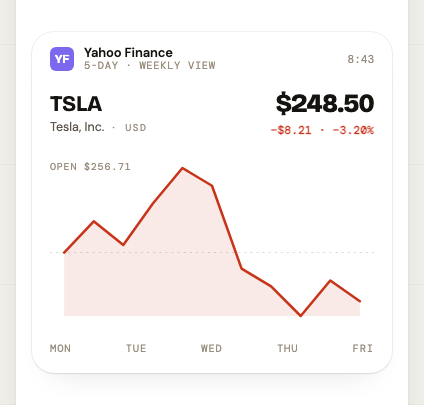
A line chart of a single series over a window, with axis and OHLC summary.
Fields in data
The envelope around data (publisher, label, expiresAt…) is the same on every type: see the envelope.
| Field | Type | Notes | |
|---|---|---|---|
variant | "v1" | optional | Design variant to render (defaults to v1). |
symbol | string | required | 1–16 chars |
name | string | required | 1–120 chars |
glyph | string | optional | 1–4 chars |
value | number | required | |
change | number | required | |
changePct | number | required | |
open | number | optional | |
dayHigh | number | optional | |
dayLow | number | optional | |
currencySymbol | string | optional | 1–8 chars |
currency | string | optional | 2–8 chars |
points | array of number | required | 2–2048 items |
axis | array of string | optional | 2–12 items · each 1–16 chars |
period | string | required | 1–8 chars |
windowLabel | string | optional | 1–40 chars |
windowShort | string | optional | 1–20 chars |
How it renders
- The header is the market treatment:
symbolat 22pt,name · currencybeneath it,currencySymbol + valueon the right withchange · changePctunder that. - Header numbers and the OPEN annotation always render to two decimal places, so a count of 22 reads as "22.00". Counts with a natural scale (revenue, minutes, thousands) sit better here than small integers.
opendraws a dashed horizontal line across the plot and theOPEN …annotation above it; both are simply absent when you don't send it.axislabels are spread evenly across the full width regardless of where those dates actually fall inpoints— send labels that are themselves evenly spaced through the window.
Craft
pointsis the whole story: send one value per interval in the window (30 daily points forperiod: "30D"), oldest first.axistakes 2–4 evenly-spaced labels, not one per point:["MON", "TUE", "WED", "THU", "FRI"]for a week, month-day stamps for a month.periodis the short code on the card ("1D", "5D", "30D");windowLabelis the long form ("Last 30 days") used in prose.- For counts rather than money, set
currencySymbol: " "— the card prefixes values with "$" otherwise. value/change/changePctdescribe the latest point against the previous one, so the header and the curve agree.- Send
open— it's what the dashed reference line is drawn from. For a non-financial series it's the first point of the window, which turns the curve into "up or down since we started watching". symbolandnameare read together, big then small: "DAU" over "Daily active users". Don't makenamea longer spelling ofsymbol, and don't repeat the publisher there.
Avoid
- Don't send fewer than ~7 points — a short series renders as an angular zigzag rather than a trend.
- Don't label every point on the
axis; the labels overlap and the card looks cluttered. - Don't use
chartfor two series (this vs. last month) — the treatment draws one line. Send the comparison as akpidelta instead. - Don't send
currencyfor a non-financial series — the tag is there to say USD vs AUD, and "· COUNT" next to the name reads as a mistake. Leave it off and no tag is drawn.
Examples
Complete payloads for POST /api/v1/feed/items or the MCP publish_pane tool.
A five-day equity trend where the shape matters more than the tick
{
  "type": "chart",
  "publisher": "Yahoo Finance",
  "publisherInit": "YF",
  "publisherColor": "#7B68EE",
  "label": "This week",
  "data": {
    "symbol": "TSLA",
    "name": "Tesla, Inc.",
    "currency": "USD",
    "currencySymbol": "$",
    "value": 248.5,
    "change": -8.21,
    "changePct": -3.2,
    "open": 256.71,
    "dayHigh": 272,
    "dayLow": 244.1,
    "points": [
      256.71,
      262.3,
      258.9,
      265.2,
      271.4,
      268.1,
      254.7,
      251.2,
      246.8,
      252.3,
      248.5
    ],
    "period": "5D",
    "axis": [
      "MON",
      "WED",
      "FRI"
    ],
    "windowLabel": "5-day",
    "windowShort": "5 days"
  }
}
A product metric over a month — counts, not currency
{
  "type": "chart",
  "publisher": "Panes Ops",
  "publisherInit": "P",
  "publisherColor": "#FF5A1F",
  "label": "Last 30 days",
  "data": {
    "symbol": "DAU",
    "name": "Daily active users",
    "currencySymbol": " ",
    "value": 1482,
    "change": 96,
    "changePct": 6.9,
    "open": 1180,
    "points": [
      1180,
      1204,
      1156,
      1233,
      1290,
      1247,
      1198,
      1265,
      1310,
      1288,
      1342,
      1301,
      1276,
      1355,
      1389,
      1362,
      1298,
      1341,
      1404,
      1437,
      1398,
      1352,
      1411,
      1466,
      1443,
      1389,
      1425,
      1478,
      1386,
      1482
    ],
    "period": "30D",
    "axis": [
      "JUL 6",
      "JUL 20",
      "AUG 4"
    ],
    "windowLabel": "Last 30 days",
    "windowShort": "30 days"
  }
}